
It’s hard to not hear acronyms like KPIs and OKRs thrown about in work conversations and meetings without reservation. In any industry and at all layers, people use KPIs to evaluate their performance and make improvements. Unfortunately, the overuse and improper implementation of KPIs has sometimes made them more of a joke than an agent for change. Luckily, KPIs don’t have to be like this.
In the process industry, tracking KPIs like asset efficiency, energy use intensity (EUI), and the defect rate help organizations achieve their yearly goals. But, how should you decide on what KPIs to monitor?
Using Key Performance Indicators
There are plenty of books, articles, and blogs describing what key performance indicators are and how to create them. Don’t lose focus when creating them though—you should always ask yourself if this KPI encourages improvement or change. If it doesn’t, it’s not a good KPI. This doesn’t mean the data is not useful; it’s maybe better served as a status or reporting number.
Some other tips to keep in mind:
- More KPIs, More Problems: it’s not hard to make everything important and urgent. But you must make a choice on what to focus on. Don’t be afraid to use a toddler’s favorite question: “why?” This will help you home in on what is important to achieving your goals. “Because we can measure it” is not a valid reason.
- Think Differently: since the KPI is meant to encourage improvement or change, a single KPI will probably not encourage change for everyone as it’s difficult to be all things for all people. It’s ok to have groups or departments with different KPIs based on their focus and role. Think about creating different KPIs for specific audiences.
- Know Your Context, Know Your Goal: it’s always a good idea to learn from others so you don’t have to recreate the wheel, but that doesn’t mean you can just hit CTRL + V. Your context and your goals are key in creating effective KPIs. Also, when creating your KPI dashboards, make sure you include context. It may be apparent when you first make the dashboard, but will it be in 3 months or a year? Clearly document what the KPIs are and why you care.
- Use Dashboards: don’t create KPIs never to be seen again until next year. There are quite a few technology vendors including data historians that provide dashboards to prominently display KPIs. With a few clicks, you can create and display your own dashboards. And make sure they are accurate and updated in real time or near real time. A dashboard with stagnant or inaccurate data can be worse than not having a dashboard at all.
Key Performance Indicators for Asset-Intensive Industries
We work with different types of organizations in the process industry from power generation to district energy to manufacturing. The best understand that they can transform the right data into actionable intelligence to achieve operational excellence. Here’s some of the KPIs our customers use.
Asset Efficiency for Power Generation
The goal of power generators is to be good energy stewards. Therefore, they focus on goals like maximizing asset efficiency as well as availability, reliability, and safety. For power, efficiency is the inverse of the heat rate, the amount of input needed to produce one output. An overall KPI for power generation is then gross efficiency (i.e. gross power output) versus net efficiency (i.e. gross output – auxiliary power).
Rankine Cycle
For asset efficiency, organizations use different methods based on the type of system. For example, in a Rankine cycle, the enthalpy of turbine inlet superheated steam and the enthalpy of turbine outlet wet steam determine efficiency. Factors that affect the Rankine cycle efficiency are:
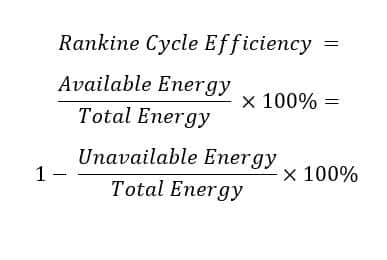
Rankine cycle efficiency calculation
- Initial pressure: turbine inlet steam pressure
- Initial temperature: turbine inlet steam temperature
- Back pressure: turbine exhaust steam pressure
In general, to improve Rankine cycle efficiency, plants can raise the initial temperate, raise the initial pressure, have a reheat cycle, or have a regeneration cycle.
Boilers
Another asset example are boilers. When looking at boiler efficiency, there is an estimated 11% efficiency loss from dry gas losses, unburned combustibles, losses due to moisture formed by hydrogen combustion, losses due to moisture in fuel, and losses due to moisture in the air. For the boiler group, creating KPIs to monitor methods to minimize these losses is a good first step for further asset efficiency analysis.
EUI and District Energy
Even though universities, airports, and districts are expanding, it doesn’t mean that the district energy plants get to expand as well. So, district energy organizations focus on improving building efficiency to reduce their demand. To monitor building efficiency, a major KPI is energy usage intensity (EUI). EUI is the amount of energy used divided by the square footage. Other data points typically monitored include chilled water, heating, and electricity usage. In this instance, district energy highlights the importance of context for KPIs as different buildings use different amounts of energy. A large laboratory should have a higher EUI than a residential building. As such, there are industry averages that organizations can compare themselves to beyond their internal comparisons.
We’ve also seen some great programs where district energy organizations have buildings compete to lower their energy usage. It’s great way to engage with their customers and make everyone be a good energy steward
Manufacturing Efficiency and Defect Rates
In other industries like manufacturing, efficiency typically revolves around the amount produced versus the defects. Related is the monitoring of large costs. For example, gas usage when there are large furnaces or electricity usage when there are big mills may be important KPIs.
Regardless of the industry, make sure your employees are a part of monitoring and improving KPIs. They are your front-line for improved operations.
We can help you improve operational efficiency and sustainability with advanced data management and predictive analytics solutions no matter what industry you’re in or the KPI’s you are measuring. Reach out to learn more!


