Throughout the workday, it’s not hard to hear the word dashboards used multiple times, followed by murmurs and nods of agreement. But what is (or isn’t) a dashboard, why are they helpful, and how do you create them?
The What
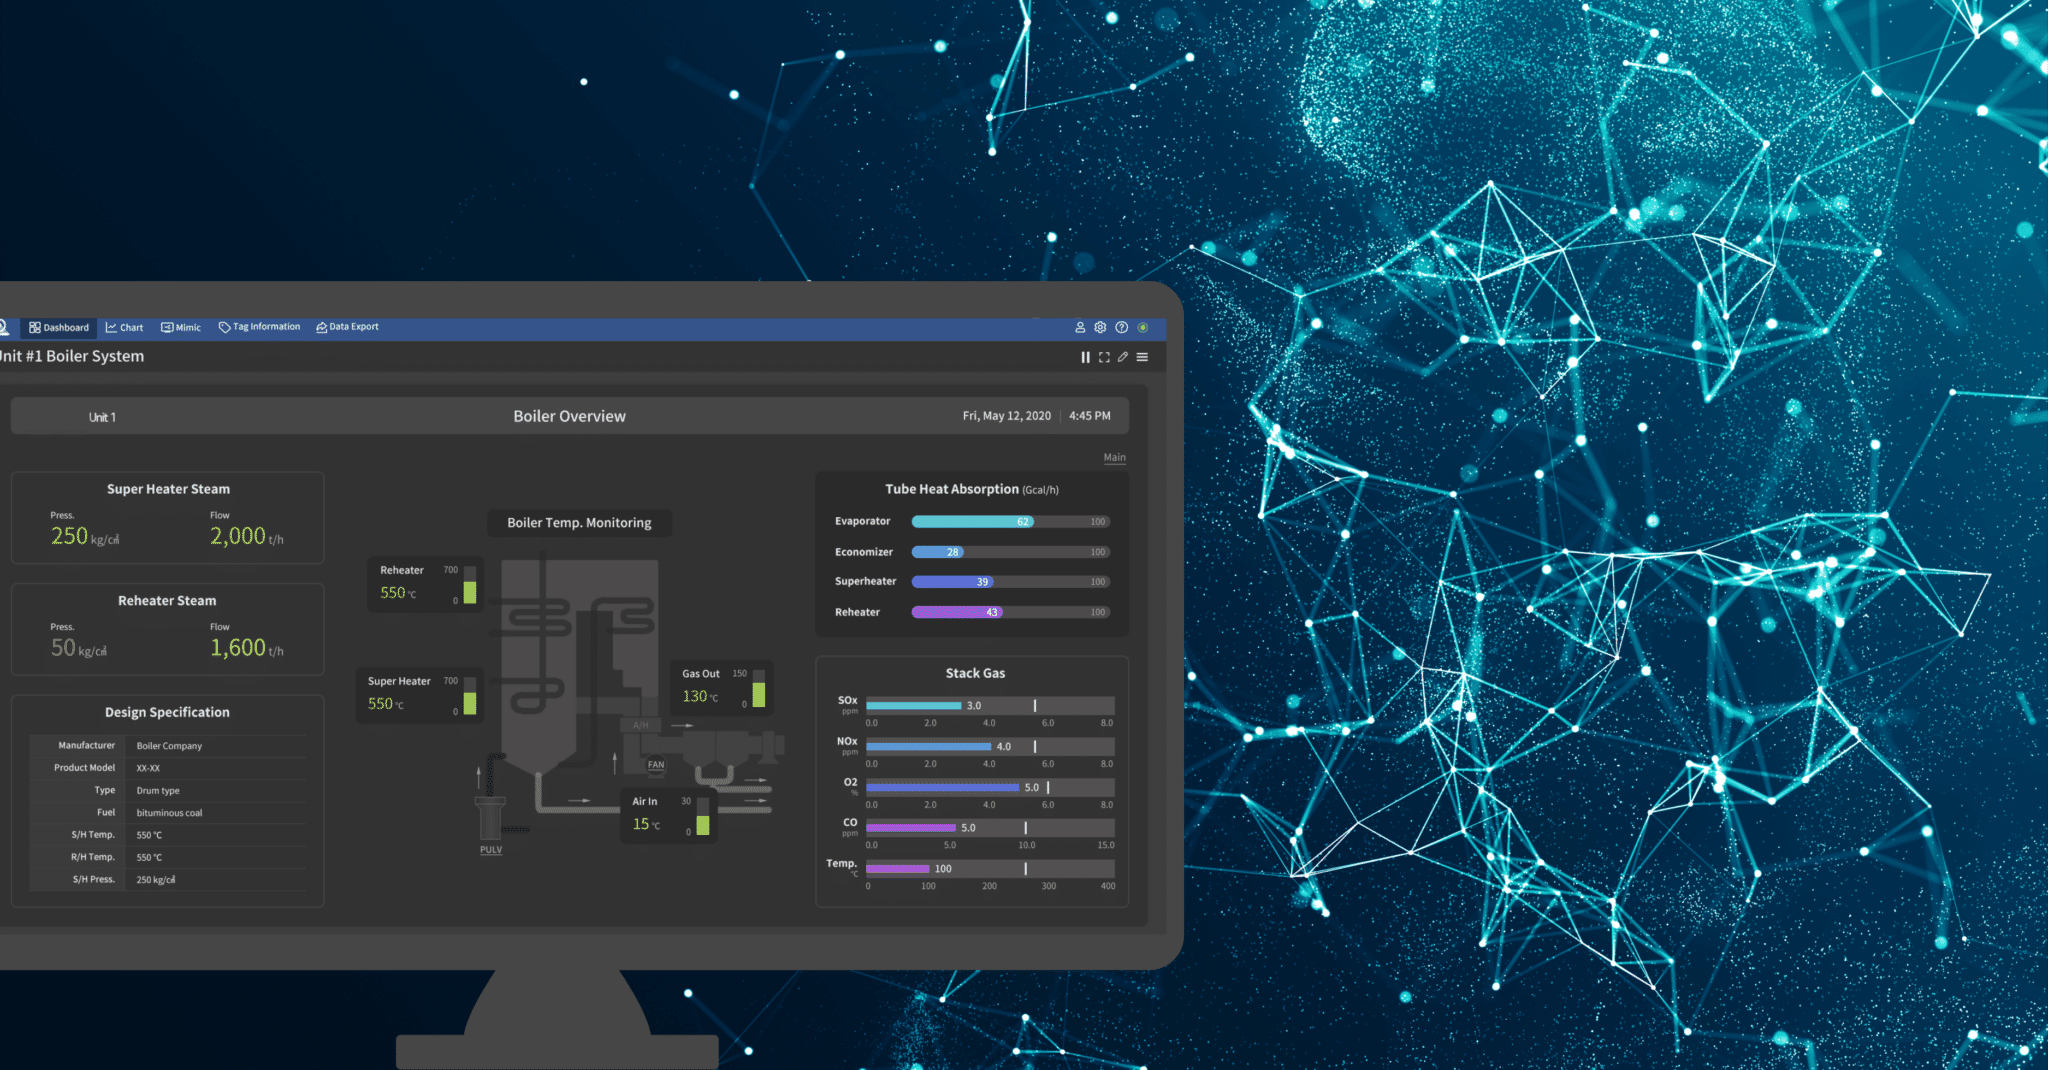
At its core, a dashboard provides information necessary for decision-making and action. A dashboard that many people are familiar with can be found in a vehicle. No matter what the make or model, a vehicle’s dash will display the speed, the fuel gauge (or range if it’s electric), the odometer, the temperature gauge, warning lights, and additional important information. What makes this a dashboard is that the information provided is not just good to know; the information is critical to operating the vehicle safely and effectively. Do I need to speed up or slow down? Should I get gas? Do I need to take my vehicle into the shop? By quickly glancing at the dashboard, I know the answer to these questions.
A vehicle dashboard is the same as a business dashboard. A business dashboard provides intelligence related to performance and operations so the viewer can know the status at a glance and have critical information necessary in the decision-making process. In a single organization, there will be different types of dashboards based on the purpose and focus of the audience. For example, the maintenance department may have a dashboard that includes the current number of open work orders, but this wouldn’t be found on the finance team’s dashboard. As a result, there will be organization-wide dashboards, department-wide dashboards, and even individual or team-specific dashboards.
So, what isn’t a dashboard? The first thing to keep in mind is that a dashboard is not simply data. Data is used to create a dashboard, but it is not sufficient. Instead, a dashboard should focus on information or key performance indicators that impact or clearly describe the current status of operations. With a clear understanding of the organization’s inputs, outputs, and desired outcomes, an organization can analyze data available to it to create a dashboard. The second thing to keep in mind is that a dashboard is not the decision-maker. A dashboard is a tool to understand operations quickly and easily. But the final decision will still require additional analysis and organizational and member expertise.
The Why
Equally important to the What is the Why. Why do we need dashboards? For HanAra, we see three main reasons: focus, planning, and action.
In everyday life, we have access to more data than we have the time or resources (or need) to analyze as individuals. At a plant, there is no difference. When a single site can have 5,000 or even 20,000 data points updated in real time, it is impossible for a single person or even a team on their own to continuously manage, analyze, and evaluate. This is where tools like dashboards and advanced technology like artificial intelligence and advanced pattern recognition come into play. Rather than trying to view all your sensor data across the site, a dashboard can display key performance or maintenance indicators. This helps you focus on current operations, not managing data.
The second reason derives from your focus, and it is planning. With a focus on current operations and equipment health, you can properly plan current and future activities. For example, just like a vehicle dashboard will indicate how soon you need to stop for gas, a good equipment dashboard can alert you to areas of priority for maintenance. Therefore, a dashboard can be the first step in the planning process.
And this leads to the third reason: action. With the right focus leading to proper planning, you and your organization can act and implement. What is good about a dashboard is that it provides you with clear indications (typically called key performance indicators) of outcomes. Are you improving? Are you decreasing? Or are you staying stable?
With a well-designed dashboard or group of dashboards, your organization will see improved focus, planning, and action.
The How
With a clear idea of what and why, we can now move on to the how. Dashboards come in a broad range of types, designs, and complexity. From a vehicle dashboard that comes built-in to a self-built dashboard in Excel, there is no one-size-fits-all solution for every dashboard need. As a result, here are some things to consider:
- Context: Like data, dashboards require context. Make sure all dashboards clearly indicate what they are displaying and how. Eliminate the potential for misinterpretation and misunderstanding by providing context. A simple first step is to make sure everything is labeled with corresponding units.
- Real-Time Insights: A dashboard should provide both historical and real-time insights. The definition of real-time may vary. For some business intelligence dashboards, hourly/daily/weekly updates may be sufficient. On the other hand, you may require near-real-time dashboards when monitoring equipment health.
- Built-In Tools: Though you can develop your own, there are solution providers like HanAra that help you quickly and easily create dashboards as well as update the data. For example, by linking your dashboard to your data historian, like HanPrism, you can use drag and drop features to develop equipment dashboards to share throughout the organization.
- Visualizations: include visualizations to provide a richer understanding and analysis. Something as simple as a line chart helps the audience quickly and easily understand the current status compared to the past. A note of caution with visualization, always ensure analysis comes first over design. For example, it may look better to have a trend chart range that is small to show variations. But if it gives the audience an idea of significant volatility or change when there actually isn’t one, it’s not a good visualization or dashboard.
- Access: Make sure those in your organization who need access or would gain value from viewing the dashboard have it. There is no point in having a dashboard that is regularly updated but no one looks at it.
Next Steps
Interested in learning how HanAra has helped its customers create dashboards for improved operations? Reach out to us today to find out how we help our customers improve operations with HanPrism and its intuitive dashboard feature.


