DISTRICT HEATING & COOLING
Improved Asset Reliability and Availability
To Ensure a Stable Supply of Heating, Cooling, and Electricity
WHEN YOUR SYSTEM FAILS, AN ENTIRE COMMUNITY IS AFFECTED
OUR SOLUTIONS PROVIDE ACTIONABLE INTELLIGENCE
TO MAINTAIN RELIABLE OPERATIONS
VALUE WE PROVIDE
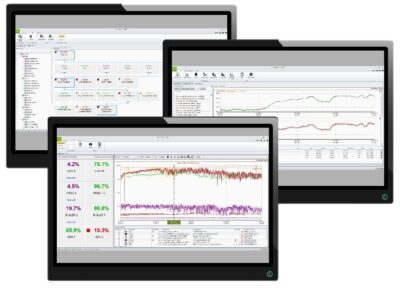
REPORTING
Purpose: Identify buildings with energy usage increases or decreases
Raw Data
- Electrical meter values
- Chilled water meter values
- Steam meter values
- Meter check
Summary Review
- Top 10 buildings with usage overages
- Cost over expected
Purpose: evaluate performance of chilling stations monthly
Raw Data
- Evaporator Water Flow
- Entering Chilled Water Temp
- Leaving Chilled Water Temp
- Calculated Chiller Output
- Delta T
- Chiller kW Usage
Monthly Review
- Output (Total Ton Hrs for Day)
- Power Use (Total Power Con Day in kWh)
- Avg kW/Ton
Purpose: monitor gas budget monthly (actual vs budgeted)
Raw Data
- Gas Flow
Monthly Review
- Last FY Actual Gas Use, mmBtu
- Gas Use Budget, mmBtu
- Base Load, mmBtu
- Actual from Meters, mmBtu
- Locked and Swing Volumes (Costs)
Purpose: monitor overall power plant (monthly and annually)
Monthly Review: Electrical Production
- Total Generated MWH
- Total System MWH
- In-Plant MWH
- In-Plant PCT
- Total System MWH from System Power
Monthly Report: Steam Production
- 425 PSI Steam Produced
- In-Plant Use
- In-Plant PCT
Monthly Report: Energy to Distribution
- Total MWH to Distribution
- Total Steam to Distribution, Lbs
Monthly Review: Performance Measures
- Total Plant Output mmbtu
- Total Plant Input mmbtu
- Plant Thermal Efficiency
- Plant Heat Rate
- HDD Base 65
- CDD Base 50
Purpose: monitor chilled water production and system and compare by month and year
Raw Data
- Chiller Tons Output
- Chiller Evaporator Flow
- Chiller Evaporator Water Inlet Temp
- Chiller Evaporator Water Outlet Temp
- Chiller Station Output
- Chiller Mixed Return Temperature
- Chiller Return Tunnel Temperature
Summary Review
- Total System
- Peak Output (Tons)
- Average Output (Tons)
- Min Output (Tons)
- System Delta T
- Peak Delta T
- Average Delta T
- Min Delta T
KPI MANAGEMENT
Purpose: track continuously key indicators and performance metrics across the organization
Indicators
- Energy to campus (mmbtu), electricity, heating, cooling)
- Power to chilling stations
- Natural gas use
- Overall average monthly total efficiency (total sought over bought)
- Electricity, heating, cooling/total fuel in
- Average annual total efficiency
- Heat Rate
- Delta T
- KW/ton
- Reliability
- Safety
- Condensate return % and quality
- Parasitic loads in plants
- Chilled water DP (supply vs distribution)
- HDD, CDD
- Water and wastewater consumption
SOLUTIONS WE PROVIDE
DISTRICT ENERGY STORY

THE UNIVERSITY OF TEXAS AUSTIN
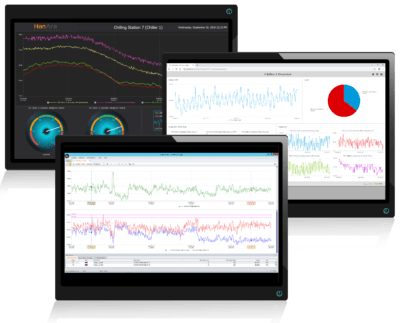
To reduce unexpected equipment failures, unplanned maintenance activities, and outage time, UT Austin chose HanAra Software’s HanPHI solution as its condition-based predictive monitoring solution.
With the implementation of HanPHI, HanAra provided the UT Austin team with the information to simplify and speed-up the decision-making and maintenance process. With a centralized location for data and the capacity to utilize predictive maintenance, HanPHI also eliminates redundant and unnecessary maintenance and support costs.
With the implementation of HanPHI, we now have usable data. Without manual calculations and long hours, we have the ability for deep insight into all of our systems, which allows us to optimize our efficiency.