OIL & GAS

Ensuring Safe and Reliable Production
In Downstream, Midstream, and Upstream Environments

CONSTANT VISION INTO THE HEALTH STATUS OF EQUIPMENT AND
EARLY WARNINGS OF POTENTIAL FAILURES
INCREASE OVERALL SAFETY AND REDUCE UNEXPECTED DOWNTIME

SMART PRODUCTION

UPSTREAM

MIDSTREAM

DOWNSTREAM

VALUE WE PROVIDE

SOLUTIONS WE PROVIDE
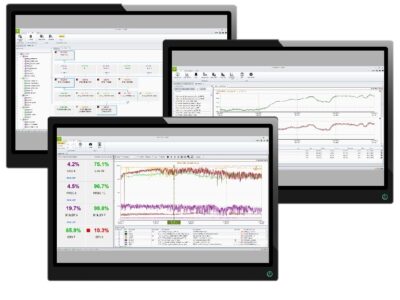
Three tablets showing different screens. From right to left: HanPHI's SuccessTree with root-cause analysis from the plant level to the tags, HanPHI's home screen showing the health index of a power plant and correlating trends, and a trend comparison.
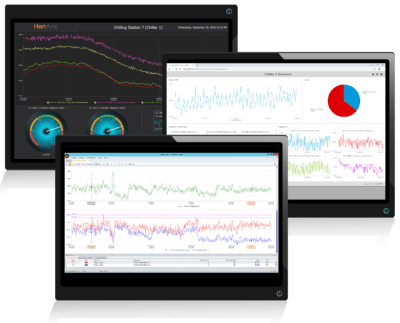
Three tablets with different screens overlaying one another. From right to left: HanAra Dashboard with a trend and gauges, HanPrism trend comparison, and a third dashboard.

YOUR DATA HAS MORE TO SHARE

Let Us Help You Break Through the Limitations
DISCOVER MORE