What Is Predictive Maintenance?
Every facility, no matter how well-built, will eventually need maintenance. The question has never been whether to maintain equipment, but when and how. In the past, that question was answered reactively (fix it when it breaks) or preventively, on a fixed schedule regardless of actual equipment condition. Both approaches leave value on the table: reactive maintenance results in costly, unplanned downtime, while time-based preventive maintenance often services healthy equipment unnecessarily or misses failures that don’t follow a predictable timeline. In fact, research dating back to a landmark 1978 United Airlines study found that many failure modes aren’t time-based at all, which means a calendar alone is a poor guide for maintenance planning.
Predictive maintenance (PdM) represents the next evolution. Rather than guessing based on elapsed time, PdM uses real-time and historical equipment data (for example, vibration, temperature, performance trends, and other operating signals) to detect early warning signs of degradation before they become failures. Advances in sensors, connectivity, and machine learning have made this kind of continuous, condition-based monitoring practical across entire fleets, not just a handful of critical assets.
The result is a shift in how maintenance teams operate: from reacting to breakdowns to anticipating them. With earlier visibility into developing issues, organizations gain the lead time to diagnose root causes, source parts, and schedule repairs on their own terms. This in turn reduces unplanned downtime, extends equipment life, and frees up resources otherwise spent on unnecessary work.
This toolkit is designed to help operationalize (or optimize) PdM at your organization.
Predictive Maintenance Further Reading
Predictive maintenance sits at the intersection of engineering, data science, and operational strategy, and a strong foundation in the underlying concepts will help you get the most out of the rest of this toolkit. The references below offer a deeper dive into the principles, methods, and management practices behind condition-based and predictive maintenance. Whether you’re building a business case, standing up a monitoring program, or refining an existing strategy, these texts provide both the theory and the practical guidance to support your work.
- RK Mobley’s An Introduction to Predictive Maintenance: A widely cited primer that covers the fundamentals of predictive maintenance.
- JR Nicholas’s Asset Condition Monitoring Management. A practitioner-focused treatment of condition monitoring as a managed discipline.
- Reliabilityweb’s Uptime® Elements — Complete Body of Knowledge. A comprehensive reliability framework presented as a management system rather than a single technical manual.
Want to keep exploring? The HanAra blog dives deeper into many of the ideas in this toolkit. A few good starting points:
- Predictive Maintenance History: Over the Years to Now: how maintenance evolved from reactive to predictive.
- Predict and Prevent: Improving Your Maintenance Strategy: comparing corrective, preventive, and predictive approaches.
- Key Benefits of a Predictive Maintenance (PdM) Strategy: how PdM reduces unnecessary maintenance and avoidable downtime.
- Advantages of Employing Predictive Maintenance: the direct and indirect payoffs of a PdM program.
Customer Story: Why Predictive Maintenance Matters
The case for predictive maintenance is clearest when you see it working in a real operating environment. Consider Korea South-East Power Company (KOEN), one of South Korea’s major power producers, generating roughly 10% of the nation’s electricity across its fleet of thermal and combined-cycle plants.
Like most power generators, KOEN faced a familiar set of problems. Traditional alarm systems could flag a value once it crossed a threshold, but by then there was often little time to act — and not enough warning to plan around a potential failure. Maintenance scheduled around equipment age didn’t help much either, because many failures don’t follow a predictable timeline; they happen at random. The result was the kind of unplanned downtime every plant dreads.
What KOEN needed wasn’t more alarms. The team needed a system that could learn the normal operating behavior of each piece of equipment, detect the earliest signs of degradation, and provide enough lead time to plan maintenance before a failure occurred.
That’s exactly the shift predictive maintenance enables. After implementing a PdM solution (HanPHI) in 2012, KOEN moved from reacting to problems to anticipating them. The system continuously monitors equipment in real time, learns each asset’s normal patterns, and surfaces impending issues with days or even weeks of advance notice. The payoff was both operational and financial: an estimated $700,000 in savings within the first three months, growing to roughly $4 million over about two years — alongside better asset protection, higher availability, longer equipment life, and reduced maintenance costs.
The lesson for any asset-intensive operation is straightforward. Failures rarely announce themselves on a convenient schedule, and waiting for an alarm often means waiting too long. Predictive maintenance changes the equation by turning raw equipment data into early, actionable warning and buying back the one resource that matters most when a critical asset is at risk: time.
Read the full case study: Efficient Plant Operation with HanPHI at KOEN
Tips for Predictive Maintenance Success
Good predictive maintenance comes down to a few things: putting your effort where it pays off, getting your data in order, learning to read the early signals, and acting on what you find. Here are four tips to get you there.
It’s tempting to begin with your most critical assets, and that instinct isn’t wrong. A failure there carries the biggest operational and financial consequences. But critical assets are often already the most heavily instrumented and watched, which means a new PdM program may add less incremental value there than you’d expect.
A practical alternative is to start with the equipment that quietly costs you the most: the asset that keeps failing unpredictably, the recurring nuisance that drains labor hours and disrupts schedules, or a class of equipment that has historically flown under the radar of your existing monitoring. These are often where PdM delivers the fastest, most visible wins. And an early win helps build momentum and buy-in across the team.
To decide, weigh three factors for each candidate asset: the impact of a failure, how often it fails, and what a failure costs to repair or work around.
Where does this data come from? You likely already have most of it. Failure frequency lives in your CMMS work-order history or maintenance logs; downtime and repair costs can be estimated from past outage records, parts and labor invoices, or production-loss figures from operations. Where hard numbers aren’t available, a rough estimate from the people closest to the equipment is enough to rank priorities as precision matters less than relative comparison.
Tip 1 Toolkit: PdM Asset Ranking
Score and rank candidates in a simple worksheet so the decision is transparent and defensible. For example, for each candidate asset, rank from 1-5 on the three factors below (1 = low, 5 = severe/frequent/costly) and multiply for a priority score. The higher scores are stronger PdM candidates.
| Asset Name | Failure Impact (1-5) | Failure Frequency (1-5) | Downtime/Repair Cost (1-5) | Priority Score (Impact × Frequency × Cost) | Rank |
| Asset #1 | 4 | 5 | 3 | 60 | 1 |
| Asset #2 | 2 | 3 | 4 | 24 | 3 |
| Asset #n | 5 | 1 | 5 | 25 | 2 |
Scoring
- Failure Impact: 1 = minor/cosmetic, 3 = partial production loss, 5 = full line/plant down
- Failure Frequency: 1 = rare (less than once a year), 3 = a few times a year, 5 = monthly or more
- Downtime/Repair Cost: 1 = low, 3 = mid, 5 = high
The most powerful predictive insights come when your maintenance records and operational process data tell the same story. To do this:
- Integrate your historian (process) data with your CMMS (maintenance) records so you can see equipment behavior and maintenance events side by side.
- Use clear, consistent tags for key parameters such as run-time, start/stop events, vibration, and temperature, so data can be compared reliably across assets and over time.
- Compare historical process trends against documented failure events to surface recurring patterns and early warning signs you can act on going forward.
Tip 2 Toolkit: Tag Naming Convention
Use this structure to standardize tags across your historian. Fill in your own segments, then apply consistently.
Build your convention in a simple worksheet: segment | purpose | your options.
For example, AREA (system, process area, or line: BOILER, AREA5, MIXING, PKG2) | EQUIP (equipment ID: PMP101, MTR204, HX07) | VAR (variable measured: TEMP, VIB, PRESS, FLOW) | TYPE (signal type: PV/process variable, SP/setpoint, ALM/alarm).
- Your convention: AREA_EQUIP_VAR_TYPE
- Example: AREA5_PMP101_TEMP_PV → Area 5, Pump 101, Temperature, Process Variable
Operating more than one site? Add a SITE segment to the front: SITE_AREA_EQUIP_VAR_TYPE.
Hard alarms have their place, but they only fire once a value has already crossed a fixed limit. And by then, the problem is often well underway. The real advantage of predictive maintenance comes from catching the slow drift toward failure long before any threshold is breached.
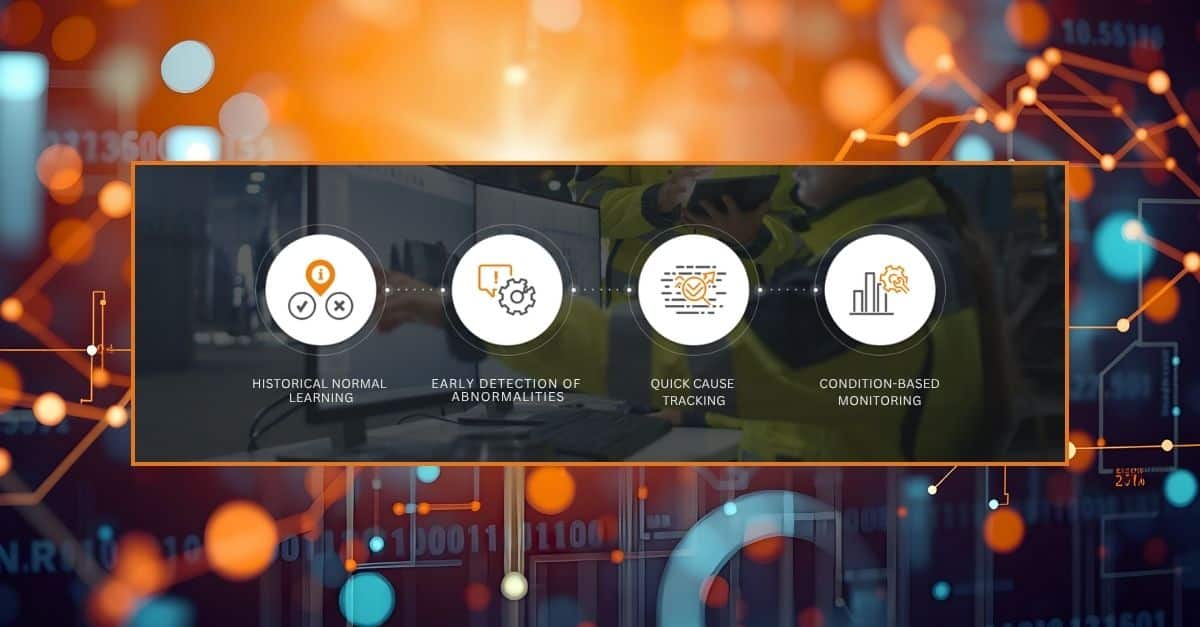
The key is to model what normal looks like for each individual asset, then watch for deviations from that baseline. Instead of relying on static setpoints, advanced pattern recognition learns each piece of equipment’s normal, fault-free operating behavior from historical data and continuously compares real-time values against those expected values. When the two begin to diverge, you get an early warning of a developing issue, often days or weeks ahead of a failure.
To put this into practice:
- Build your monitoring on each asset’s actual operating patterns, not generic threshold alarms. Models trained on your own equipment, in your own process conditions, catch the subtle shifts that one-size-fits-all setpoints miss.
- Watch the trends, not just the moment. Gradual changes are the early signatures of many faults, and pattern recognition surfaces them before they ever trip a conventional alarm.
- Translate equipment health into something everyone can act on. A simple health score (for example, a 0–100% index) lets teams see immediately which assets are healthy and which are trending toward trouble.
- Make it easy to trace a warning back to its source. The ability to drill down through the asset hierarchy (from plant, to system, to the individual sensor) means that when something deviates, you can pinpoint exactly where and why.
Tip 3 Toolkit: PdM Response Checklist
Use this six-stage workflow to move from a detected deviation to a resolved issue, so every warning follows the same defined path rather than depending on who happens to notice it.
1. Monitoring
- Monitor equipment health index
- Review index at fleet, site, and equipment level
2. Reporting
- Identify deviations from normal using built-in monitoring tools
- Report deviation to on-site personnel for additional context
3. Analysis
- Analyze trends and context for troubleshooting and root-cause analysis
- Take corrective action if it’s quick to fix, or plan additional analysis/maintenance
4. Confirm
- Review past operations using alarm history and tag memos
- Determine what actions, if any, were previously taken on this equipment
5. Action
- For critical issues, order an emergency shutdown or perform immediate maintenance
- Plan and implement standard maintenance
6. Result
- Prepare maintenance report
- Resume 24/7 monitoring
Detection is only half the battle as a warning that no one acts on is worth no more than no warning at all. The programs that deliver real value are the ones where every signal reliably triggers a response, and that takes a bit of deliberate design rather than good intentions.
Start by making sure warnings reach the people who can do something about them. Automated alerts or scheduled reports should go to both the maintenance and operations teams, so nothing important sits unseen in a system someone forgot to check. From there, take the guesswork out of what to do by pairing early detection with standard operating procedures and clear action steps. Depending on what the data shows, that response might mean kicking off additional analysis, taking direct action on the floor, or sending a notification to the right team. When the path forward is already defined, teams don’t have to debate it in the moment.
Finally, treat the loop as something you maintain, not something you set once. Ongoing training and regular cross-team coordination keep responses consistent as people, equipment, and conditions change, so a warning prompts the same timely, effective action whether it’s caught on a Tuesday morning or a holiday weekend.
Tip 4 Toolkit: Feedback Health Review
Use this recurring self-audit to make sure the feedback loop stays effective over time, not just when it’s first set up.
- Every Warning/Critical alert from last quarter has a documented response
- Notification lists (maintenance + operations) are current, no departed staff still listed, no new hires missing
- SOPs referenced in the escalation path were reviewed/updated in the last 12 months
- Cross-team training on response procedures happened at least once this quarter
- Any gaps identified (missed alerts, undefined response for a deviation type) are logged and assigned an owner
Cadence: Run this quarterly, aligned with the Tag Cleanup Checklist review, which is a natural pairing since both are recurring maintenance tasks for the PdM program itself, not just the equipment it monitors.
Go Further: Tools to Put This into Practice
The tips in this toolkit lay out the thinking behind a successful predictive maintenance program. When you’re ready to put that thinking to work, our team has a set of practical, ready-to-use resources to help you move from concept to implementation. Reach out and we’ll share:
Data-Readiness Checklist: A quick self-assessment to gauge whether your historian data is ready to support reliable predictions, plus where to focus first if there are gaps.
Phased Implementation Roadmap: A step-by-step guide to standing up a PdM program in the proven way: assess your current state, pilot on a focused set of assets, expand, and sustain.
PdM ROI & Savings Estimate: Work with our team to estimate the downtime, repair, and labor costs a predictive program could recover at your facility, so you can build a business case with real numbers behind it.
Ready to get started? Contact us to receive these resources and talk about how they apply to your operation. Or try our Savings Calculator to get an instant first estimate of what PdM could save you.