A data historian is the system that turns a plant's continuous stream of sensor readings into a durable, searchable record. How well it does that depends on decisions most users never see: how data is collected, how it is stored, and how it is retrieved. This guide explains those mechanisms with each section covering one stage of the data's path.
What Is a Historian?
A Time-Series Database Built for Plant Equipment Data
A historian is a time-series database: it stores values indexed by tag and time, not rows linked by relationships. That single design choice explains most of how it behaves.
A relational database (the kind behind a CMMS or ERP) is optimized for records that are created, updated, and joined: a work order, an asset record, an invoice. Plant data is different. It arrives continuously, it is typically not updated after it is written, and it is usually queried by time range: "show me P-101 discharge pressure for the last 30 days."
A historian is built around that pattern with four main fields:
|
Field |
Example |
Purpose |
|
Tag |
P101_DISCH_PRESS | Identifies the signal |
|
Timestamp |
2026-10-20 14:03:27.250 UTC |
Orders the data and aligns it with other signals |
|
Value |
145.2 |
The measurement, in the tag’s engineering units |
|
Quality |
192 (Good) |
Whether the value can be trusted |
Metadata such as tag descriptions, units, ranges, and equipment relationships is usually kept in a more traditional relational database, while the measurements themselves live in the time-series store. Using each type of database for what it does best keeps the whole system fast. That metadata is what makes the data interpretable, as covered in the context section below.
Go deeper: Data Management in an Industrial Environment (Dataversity) traces how historians emerged from the limits of relational databases. HanPrism is HanAra's historian platform.
Where Does the Historian Sit?
Industrial Architecture and Connectivity
The historian is most often placed at Level 3 of the ISA-95 model, sitting above the control systems that generate data and below the business systems that consume it. Exact placement depends on the organization's needs and network segmentation. For example, a historian may sit closer to the controls at Level 2, in the industrial DMZ (often called level 3.5), or at the enterprise level. Many sites run historians at more than one level such as a site historian at each plant feeding a corporate historian at headquarters.
- Data sources are upstream of the historian. Sensors and transmitters measure the process; PLCs, DCS, and SCADA systems use those measurements to control it. These systems acquire and act on data in real time but were traditionally not designed to archive it for years. The historian collects a copy of that data without interfering with control.
- Interfaces connect the two. An interface (also called a connector) reads data from a source system and passes it to the historian with its timestamp and quality. Common protocols include OPC DA, OPC UA, Modbus, BACnet, and vendor-native interfaces. The source system must support the protocol; the historian supplies the matching interface capability.
- Third-party integrations connect other systems. Maintenance records (CMMS), production data, and business systems such as ERP can be connected through API connections, native integrations, or ODBC drivers, depending on the system and the need. Data can also be pulled into the historian from SQL databases, so it appears on the same timeline as process data and expands what dashboards and analysis can show.
- Security shapes the layout. Data should flow up and out; the historian should not be able to send commands down into the control network. Many sites mirror the plant historian into an industrial DMZ so corporate users never connect into Level 3, and some use hardware-enforced unidirectional gateways.
Go deeper: The Readiness Checklist covers protocol, firewall, and legacy-equipment checks. Plant Data Integration covers connecting multiple systems.
What Does a Historian Do with Data?
Collecting Data: Resolution, Timestamps, and Quality
The type of data a historian collects depends on the tag. Analog tags hold continuously variable values such as temperature, pressure, flow, or motor current. Digital (discrete) tags hold a limited set of states, such as pump on/off, valve open/closed, or an operating mode.
The distinction affects how data is collected, displayed, and calculated. Analog values are trended as continuous lines, while digital values change in steps and hold their state until the next change. Setting tag types correctly during configuration keeps trends, reports, and calculations accurate. Beyond this, what the historian collects is set by three things: how often it reads each tag, how the clock stamps the value, and what quality the source reports.
Data Resolution
Data resolution is the time interval at which the historian collects and stores values for a tag, for example every second or every minute. Beyond the data resolution itself, it is important to understand the visualization resolution, which sets how much detail trends and dashboards can show. Over long time ranges, a display has more stored points than screen pixels, so it must condense them. Simple sampling can hide short spikes, so make sure to understand how the historian handles its visualization display.
Match resolution to how fast the variable can meaningfully change. A tank level may need one reading per minute; a turbine speed may need sub-second data. Managing resolution this way is also a performance consideration: collecting every tag at the fastest possible rate means more frequent polling and puts unnecessary draw on controllers, the network, and the historian itself, while matching resolution to each variable keeps the whole system responsive.
Timestamps
Knowing exactly when something happened is as important as knowing what happened. Accurate timestamps let engineers line up a pressure drop with a trip, an alarm, or a maintenance event, even when that information comes from different systems.
Two practices prevent most timestamp problems:
- Store time in UTC and convert to local time only for display. This avoids duplicate or missing hours at daylight-saving changes.
- Make sure the historian accepts late and out-of-order data, which is common after communication outages.
Data Quality
Most industrial protocols, including OPC, attach a quality flag to every value. In OPC DA, 192 means Good, 64 Uncertain, and 0 Bad, with sub-status codes for specific causes such as sensor failure (16) or communication failure (24). OPC UA uses its own status codes but follows the same Good, Uncertain, and Bad structure. For more information on quality codes, see the OPC Foundation reference. A historian should store that flag with the value so analysts can exclude bad data.
Go deeper: The Data Historian Readiness Checklist covers inventorying tags, signal types, and update rates before implementation. The Buyer's Guide lists questions to ask vendors about resolution and data quality.
Organizing Data: Archiving, Retrieving, and Contextualizing
Archiving Data
How a historian manages storage depends on the vendor. Some reduce the number of stored values, for example by dropping changes smaller than a set deadband or by compressing the archive, with settings that trade storage for detail. Others store every value as it is collected.
Whichever approach a historian uses, the record is only as good as its continuity. Two mechanisms protect it.
Buffering. Gateways should store and forward. If the link to the historian server drops, the gateway holds data locally and backfills it once the link returns, so the archive has no gap.
Redundancy. Buffering protects against a dropped network link, but if the historian server itself fails, data can still be lost. Redundancy closes that gap by duplicating key components, most often the historian server, the interfaces, or both, so collection and access continue if one fails. Failover should be tested during commissioning, because a poorly configured switchover can leave brief gaps or write duplicate values.
Beyond storage, buffering, and redundancy, consider retention. Decide how long to keep data based on both operational and compliance needs. Regulatory and reporting requirements, such as environmental or emissions rules in some industries, can set a minimum period for keeping records. Predictive models also benefit from multiple years of history that covers seasonal and operating-mode variation.
Go deeper: What Is a Data Historian? discusses compression and recall speed as evaluation criteria. The Buyer's Guide lists questions to ask vendors about buffering and redundancy. The Predictive Maintenance Toolkit covers tag management for analytics.
Retrieving Data
The same stored data can give different answers depending on how it is retrieved, so knowing the retrieval mode matters as much as knowing the data.
|
Mode |
What it returns |
Typical use |
|
Raw (recorded) |
Only the points actually stored | Troubleshooting, checking exactly what was archived |
|
Interpolated |
Values at fixed intervals (e.g., every 60 s), calculated between stored points | Aligning tags for comparison, exporting to analytics or Excel |
| Aggregated | One summary value per interval: average, minimum, maximum, total, count | Reports, KPIs, dashboards |
Comparing Data Consistently
The same data can produce different results depending on how it is pulled. For example, an hourly flow average calculated as a simple average of recorded points can differ significantly from a time-weighted average when values are recorded at uneven intervals, and results also shift with the sampling interval chosen for interpolated data. Before comparing or sharing numbers, define the retrieval method, make sure everyone understands how the data was pulled, and share that method alongside the results.
Go deeper: From Spreadsheets to Smart Reports covers turning retrieved data into automated operations reports.
Adding Context
A tag value means little until users know what it measures, which equipment it belongs to, and what the plant was doing at the time. Historians supply that context in three layers.
- Tag naming and metadata. A consistent naming convention lets users find data by pattern; for example, every discharge pressure on every pump follows the same structure. Each tag should also carry a description, engineering units, and expected range. Without these, a plant with 50,000 tags becomes hard to search.
- Equipment grouping. Relating tags to the equipment they describe makes data easier to work with. An engineer looking at Pump P-101 can view its pressure, flow, motor current, and run status together rather than searching for each tag. A consistent naming convention goes a long way toward this, and structured asset models can build on it as needs grow.
- Operating states and events. Equipment behaves differently during startup, steady state, low load, and shutdown. Recording the operating mode, as a state tag or as defined events with start and end times, lets users compare like with like: today's steady-state bearing temperature against last year's steady-state values, not against a startup. This is also essential for analytics to ensure proper consideration of mixed modes.
Go deeper: Updating Your Tag Naming Convention walks through building a naming standard. Plant Data Integration covers bringing data from multiple systems into a common structure.
Using Data
Everything above serves one progression: raw data becomes organized, contextualized, analyzed, and finally acted on. A bearing temperature reading from P-101 is raw data. Stored with its timestamp and quality, it is organized. Linked to the pump and its operating state, it is contextualized. Compared against the pump's steady-state history, it becomes analysis. When that comparison shows a slow upward drift, it becomes insight, and a work order to inspect the bearing is the action.
Historian data reaches people in two ways: through tools built into the historian itself, and through integrations that feed other systems. A complete platform does both.
Built-in tools are where operators and engineers spend most of their time, so ease of use matters as much as capability. Common built-in features include:
- Trends: real-time and historical trends, plus comparison trends that overlay multiple tags or time periods to reveal changes in equipment behavior.
- Process graphics and dashboards: live views of equipment status and KPIs that operators and managers can check at a glance.
- Calculated tags: new values derived from existing tags, such as efficiency, heat rate, or totalized flow, which can be stored and trended like any other tag.
- Alarms and notifications: alerts when values cross set limits, recorded alongside process data for later review.
- Reports: templated shift, daily, and monthly reports generated automatically.
- Excel add-ins: historian data pulled directly into spreadsheets for ad hoc analysis.
Integrations extend the same data to other systems such as CMMS, ERP, and BI tools, as described in the architecture section above.
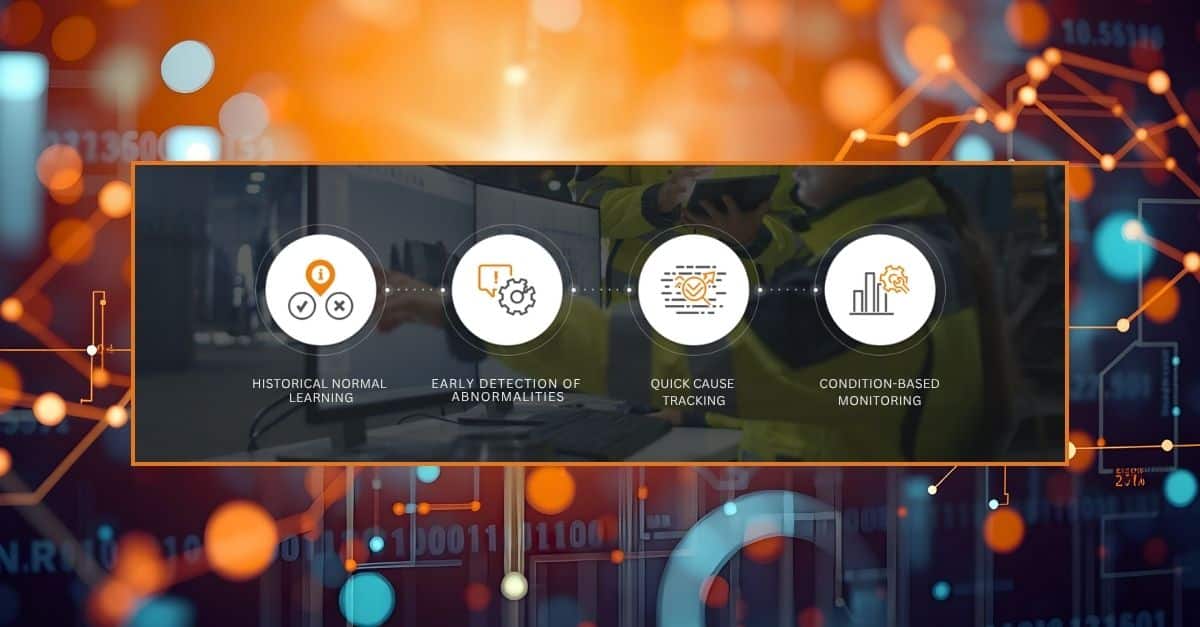
Predictive analytics depends directly on the storage, timestamp, quality, and context decisions described above. Advanced pattern recognition (APR) models learn each asset's normal relationships between variables. The solution then flags when live data drifts from that learned pattern, often weeks before a fixed alarm limit would trip.
Those models need enough historical data to represent the asset's normal operation across its typical operating conditions, captured at adequate resolution, with reliable quality flags to exclude bad data and operating-state context to compare like with like. A historian configured with those requirements in mind is the foundation for condition-based and predictive maintenance.
Go deeper: Learn more about condition-based maintenance, industrial machine learning, and HanPHI, HanAra's advanced pattern recognition solution.
How Do You Plan, Evaluate, or Migrate a Historian?
The technical choices above are easiest to get right at the start of a project. Where you are in the lifecycle determines which resource to read next.
|
If you are… |
Start here |
|
Assessing whether your current data can support analytics |
|
|
Comparing historian options |
|
|
Preparing to implement |
Data Historian Readiness Checklist and HanPrism Implementation |
|
Replacing an existing historian |
|
|
Replacing an existing predictive maintenance tool |
A historian's value is set by decisions made long before anyone opens a trend: resolution and timestamps at collection, retention at storage, retrieval mode at query time, and context throughout. Get those right, and the same data serves both day-to-day operations and predictive analytics.
Talk to HanAra. If you want a second opinion on how your current historian is configured, or whether your data is ready for predictive analytics, schedule a conversation with our team.